

Spray plume shape can be visualized with using Computational Fluid Dynamics (CFD) by applying a substantially low iso-surface of a spray concentration value.
Download the PDFDimensional, Thermal and Evaporative Spray Plume Characteristics Using Computational Fluid Dynamics
ICLASS 2009, 11th Triennial International Annual Conference on Liquid Atomization and Spray Systems, Vail, Colorado USA, July 2009
W. Kalata, K. Brown, K. M. Bade and R. J. Schick
Spray Analysis and Research Services
Spraying System Co.
P.O. Box 7900
Wheaton, IL 60187-7901 USA
Abstract
Spray plume shape can be visualized with using Computational Fluid Dynamics (CFD) by applying a substantially low iso-surface of a spray concentration value. In FLUENT’s CFD code, spray concentration is automatically calculated while applying discrete phase model (DPM). This method has been previously used in gas cooling and spray-drying applications, where the spray plume was loosely defined with low concentration value. Visualization of spray plume shape and wall attachment (wall wetting) aids in the assessment, correction and optimization of spray nozzle placement with respect to targeted gas cooling temperature reduction and minimal wall wetting. To omit loosely defined Spray Plume Boundary (SPB) value, a stricter requirement for SPB was imposed through experimentally obtained data. The spray was injected in co-flow configuration within the wind tunnel with square cross-sectional size of 0.6x0.6 m2 at air speed of 15.4 m/s. To correlate the experimental SPB with CFD based value, the numerical results were compared for the Sauter-Mean Diameter and volume flux distribution data. The experimental results were acquired with an Artium Phase Doppler Interferometer.
Based on validated criterion for SPB evaluated at 20°C, the same system was evaluated computationally with increased air inlet temperatures at 100, 400, 700 and 1000°C. To evaluate the effect of temperature on evaporation, the spray plume shape was analyzed with DPM concentration (DPMC) values, air temperature reduction between inlet and an outlet, and percentage of water evaporation inside of spray plume. As air stream temperature and evaporation rate of water droplets were increased, the SPB which was represented by DPMC iso-surfaces became more sensitive to the evaporation process. The percentage of evaporation rate measured inside spray plume’s SPB with DPMC value validated at 20°C (DPMC=0.0004 kg/m3) decreased from 96.6% at 20°C to 73.7% at 1000°C. The percentage evaporation rate inside the spray plume increased with a decrease in the DPMC value for the SPB.
Introduction
Atomization of liquid into fine droplets has proven to be extremely useful in many applications including gas cooling inside high temperature flow conduits. In today’s world, many industrial systems are designed or upgraded to demanding specifications that require high production efficiency with relatively low costs. In gas cooling, spray technology provides solutions to many complex problems. Some prevalent examples of limitations that spray cooling system faces are: accurate temperature drop, complicated flow geometries and wall wetting. Today, Computational Fluid Dynamics (CFD) has been widely adopted in many industrial processes. Advancements in computing technology and software development have significantly reduced computational costs, making the computational sciences commonly available and cost effective in engineering applications. There are few different numerical multiphase models available in FLUENT that are applicable to the spray applications. Volume of Fluid, Mixture, and Eulerian Models can be used to predict a spray nozzle’s basic characteristics. The most common model used for spray application is DPM which employs LaGrangian particle tracking of droplets’ trajectories [1].
Compared with empirical testing, numerical simulation is becoming more cost effective and more environmentally friendly. While experiments usually can only provide focused point information reliably, CFD can give detailed information in full (2D or 3D) computational domain. This is especially true in environments that are difficult to reproduce experimentally.
The focus of this study was to quantitatively investigate spray plume’s evaporative properties at various air stream temperatures defined as part of inlet boundary condition (BC). The injection properties with Discrete Phase Model (DPM) were modeled with drop size data (spray angle, flow rate, drop size distribution and their initial velocity from the nozzle) that were known based on experimental data for the given spray nozzle.
Experimental Apparatus and Setup
The experimental measurements were performed within wind tunnel with 0.6 by 0.6 m2 cross-section (Figure 1). The air speed was set to 15.4 m/s (50.5 ft/s) at 20°C (68°F). The Spraying Systems Co.UniJet® TX-2 hydraulic hollow cone nozzle was used. The operating pressure of the nozzle was set at 3.8 bar (55 psi) which gave 2.45x10⁻⁶ m3/s (2.327 gpm) or 0.00245 kg/s of liquid flow. The tip of the nozzle was positioned at the center of cross-sectional plane and aligned with center axis (tilt angle was 0°).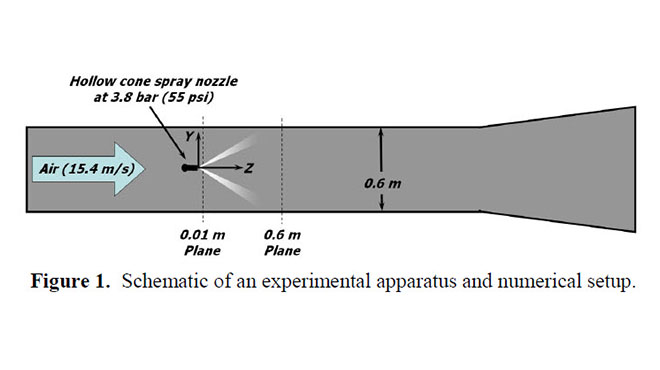
Experimental Measurements
An experimental measurement of drop size distribution was performed with Artium Phase Doppler Interferometer (PDI) [2-4]. The drop size distribution, axial velocity and volume flux were obtained 0.01 and 0.6 m downstream of the nozzle tip (Figure 2). At 10 mm from the nozzle’s tip, the spatial distributions for drop size and volume flux showed typical features for a hollow cone spray. At location of 600 mm from the tip the drop size trends remained as expected, showing that the smallest size values were located the center of the duct (aligned with the nozzle location). Conversely, the volume flux exhibited its peak at the centerline of the duct as shown in Figure 2D.
Numerical Methods
CFD simulations were performed with ANSYS FLUENT version 6.3. Generally, the CFD model was reproduced according to the wind tunnel geometry. The biggest difference was the spray lance geometry which was simplified to reduce mesh size. The modeled lance geometry was more representative of a typical spray lance configuration. Meshing was performed within GAMBIT 2.4. Dense mesh was incorporated in vicinity of spray injections. Size functions were used to further reduce mesh size. The mesh consisted of mixed elements with approximately 1.45 million cells.
The CFD model was set up with velocity inlet BC while varying air stream temperatures (20, 100, 400, 700 and 1000°C). An outlet side of the duct with constant pressure BC was employed. Lastly, duct and lance walls were specified as rigid, with no-slip and adiabatic conditions. Multiple models were used to simulate evaporative cooling. Throughout all simulations the following models were included k-L Realizable Turbulence Model, DPM for La-Grangian tracking of water droplets, Energy to evaluate thermal effects of air stream and spray injections, and finally Species Transport Model to include mixing of air and water vapor due to evaporation. In the high temperature cases (700 and 1000°C), the P-1 Radiation Model was incorporated with emissivity values of Inconel 600 for all walls.
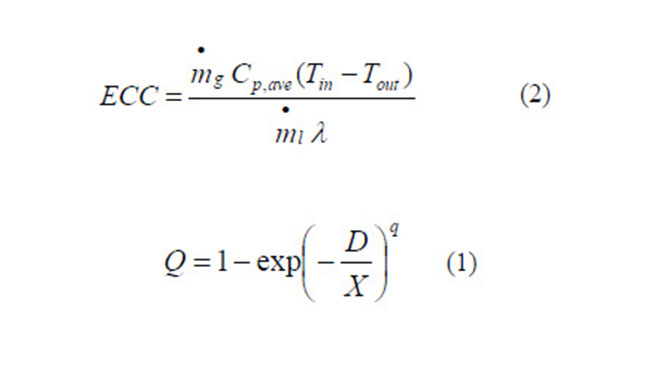
Injection drop size distribution, velocity (13.3 m/s) and spray angle (90º) were obtained from PDI measurements shown in Figure 2. Injection velocity was based on volume flux and area weighted averaged velocity from the measurement at 10 mm from the tip [5]. Also from the same location the spray angle was approximated based on the width of volume flux curve shown in Figure 2C. The drop size range that was used to specify injection in FLUENT was derived from both locations. Minimum diameter (22 μm) for CFD was specified based on volume flux and area weighted average of DV0.01 [6-8] from profile at 10 mm from the tip. The maximum diameter (220 μm) for CFD was specified based on volume flux and area weighted average of DV0.99. Injection volumetric mean velocity for CFD (108 μm) was determined based on volume flux and area weighted averages of DV0.5 from both locations. FLUENT employed a Rosin-Rammler distribution function (1) to simulate the 20,000 particles that were tracked at each DPM iteration [6]. Q is the fraction of total volume of drops with diameter less than D. X and q are constants. The user-defined function was used to calculate SMD [9] while running 50 iterations after resolving the flow field.
Using a energy balance with evaporation (2) the Evaporation Cooling Constant (ECC) was determined [10,11]. Tin and Tout are temperatures at inlet and outlet respectively, ṁg and ṁl are mass flow rates for gas and liquid, Cp,ave is the average value of specific heat at inlet and outlet, and finally λ is the specific latent heat constant.
The CFD computed values outlet temperature (Tout) and mass flow rate of evaporated water ( ṁl). Outlet temperature was evaluated based surface area weighted average at the outlet surface. Evaporation mass rate was computed with summation of all cell’s DPM mass source values.
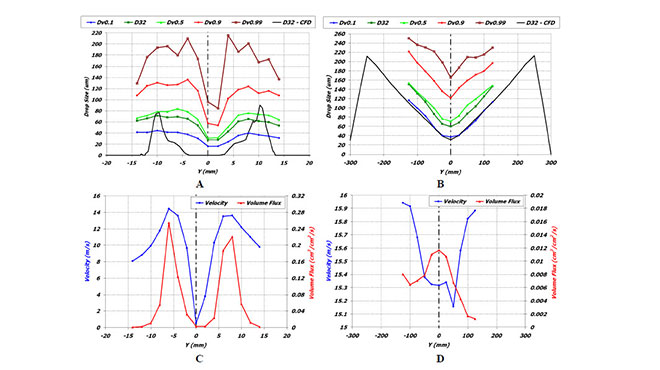
Figure 2. Drop size distribution at A. 10 mm and B. 600 mm from the tip. Drop velocity and volume flux at C. 10 mm and D. 600 mm from the tip.
Base Case Results
Base case which was computed with 20°C at inlet BC was compared with PDI measurements. These results are presented in Figures 2A and 2B. At 10 mm from the tip the shape of CFD Sauter-Mean Diameter (SMD, D32) matches the magnitude and the hollow cone trend but not the overall shape. The CFD D32 at 600 mm from the tip followed the general spatial distribution of experimental D32. On the other hand, the magnitude was under-predicted by about 25 microns. The CFD gave SMD values all across the wind tunnel’s height, thus experimental values provided data only up to certain point where experimental data rate was too low to measure drop size and other quantities.
The base case had an insignificant temperature drop of 0.1°C with 17.1% of mass evaporation out of injected mass flow rate. An initial DPM Concentration (DPMC) value to define Spray Plume Boundary (SPB) was based on matching peaks of CFD DPMC value and experimental volume flux at 600 mm from the tip. To obtain cut-off DPMC, the cut-off volume flux point (shown in Figure 2D) at about 0.002 cm3/cm2/s was matched with 0.0004 kg/m3. This SPB gave 96.6% of total evaporation rate that was located inside the spray plume shown in Figure 3 on the right side. Since the spray plume with SPB at 0.0004 did not account for the large droplets that travel outside the SPB (Figure 3), the DPMC value was lowered to 0.0001 and to 0.00001 kg/m3. This decrease gave improved evaporation percentage inside the SPB to 99.4 and 99.9% respectively (Figure 4B).
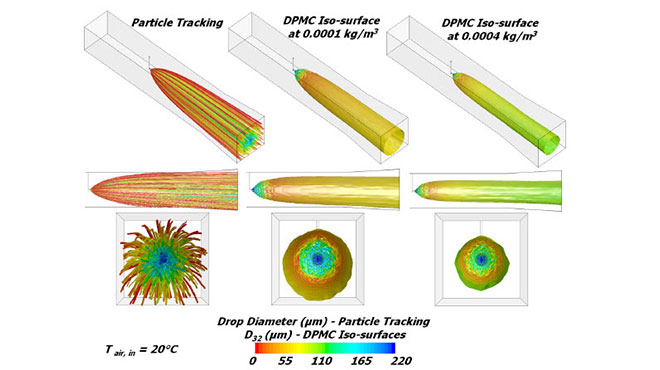
Figure 3. Spray plume characteristics for the 20°C case (base case).
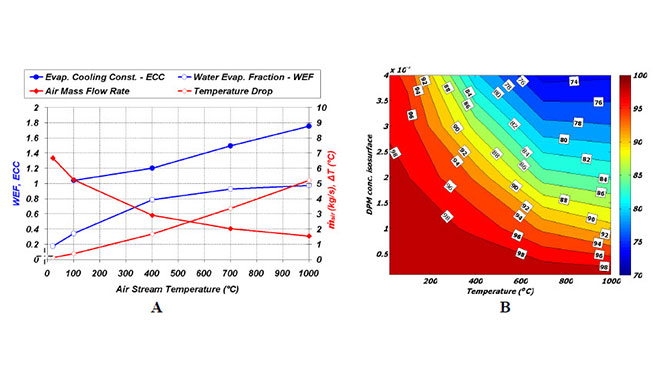
Figure 4. A. Various resulting parameters due temperature change at the inlet. B. Evaporation percentage that is inside spray plume defined by variable DPM concentration.
Temperature Results
In all cases, as temperature was increased, the mass flow rate of air decreased since the inlet BC velocity was kept constant at 15.4 m/s. In the case with inlet BC temperature at 100ºC, the total evaporation doubled to 34.1% as compared to the base case (see Figure 4A). The temperature drop was still insignificant with 0.4°C. At this point the ECC number was 1.04 indicating good correlation for Equation (1). The SPB based on DPMC at both ranging from 0.00001 through 0.0001 to 0.0004 showed that evaporation percentage within the spray plume decreased from 99.9% to 99.4% and to 96.6% respectively (see Figure 4B). Figure 4B showed increasing sensitivity of evaporation amount inside SPB as the inlet BC temperature was increased. At 1000ºC the total evaporation from injected mass rate was 97.3%, with 5.2ºC temperature drop. The ECC number was 1.75. The SPB based on DPMC at both ranging from 0.00001 through 0.0001 to 0.0004 showed that evaporation percentage within the spray plume decreased from 99.5% to 90.8% and to 73.7% respectively (see Figure 4B).
Discussion and Conclusions
The variation of DPMC threshold for SPB is dependent on the problem that needs to be resolved. If wall wetting is an issue as often is in high temperature applications, the DPMC threshold needs to be very small in order to capture the spray plume geometry. Since the largest drops are the most likely to hit the walls as shown in Figure 5, the visualization of this spray plume’s geometry should include the largest drops that are in lower end of count spectrum. If the dominant evaporative regions need to be identified, the DPMC threshold does not have to be as low in order can be used to visualize the spray plume. This is applicable in problems where cooling is a primary targeted solution and/or temperature profiles in post-cooling regions are important.
Figures 6 and 7 show the geometrical difference in SPB with DPMC values at 0.0004 and 0.00001 kg/m3 as an inlet BC temperature increases. As Figure 5 clearly shows that wall wetting occurs, only spray plumes with isosurfaces at DPMC=0.00001 kg/m3 indicated attachment to the wind tunnel’s wall. Although evaporation percentage within the spray plume did not go below 99%, the droplets were detected to make contact with walls. In this study the wall wetting is insignificant (no more than 0.5% of mass contacts the wall), but for large capacity sprays, wall wetting becomes important even in low percentages of total mass sprayed.
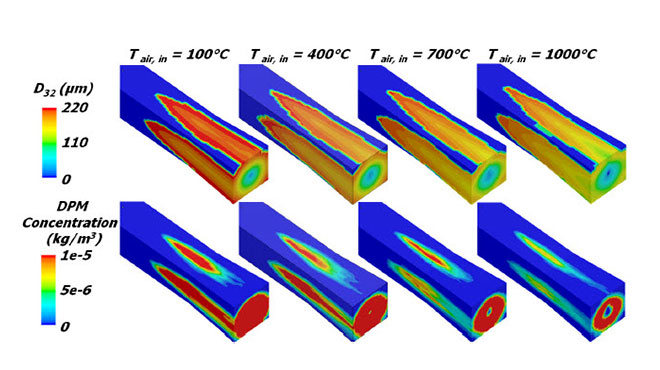
Figure 5. SMD and DPMC wall and outlet contour plots for cases ranging from 100 to 1000°C.
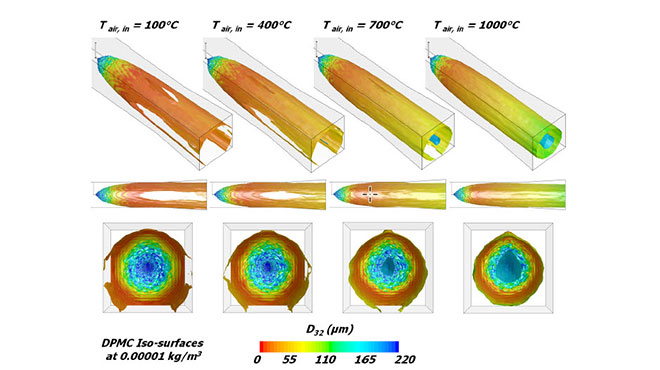
Figure 6. Spray plume iso-surfaces with SMD based on DPM concentration threshold of 0.00001 kg/m3 ranging from 100 to 1000°C.
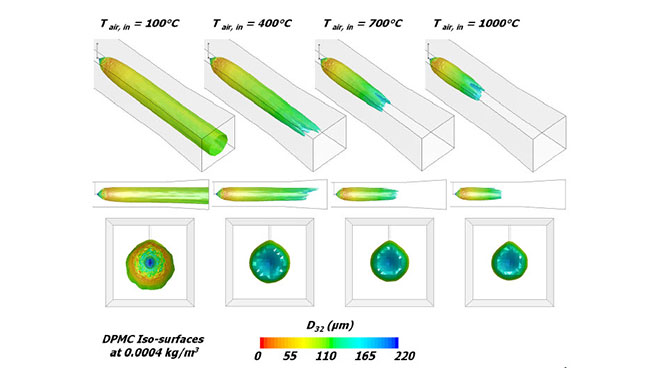
Figure 7. Spray plume iso-surfaces with SMD based on DPM concentration threshold of 0.0004 kg/m3 ranging from 100 to 1000°C.
References
- Fluent Inc. FLUENT 6.3 User’s Guide, 2007.
- Bachalo, W.D., “Experimental Methods in Multiphase Flows”, International Journal on. Multiphase Flow, Vol. 20, Suppl. pp. 261-295, 1994
- Bachalo, W.D., “A Method for Measuring the Size and Velocity of Spheres by Dual Beam Light Scatter Interferometry”, Applied Optics, Vol. 19, No. 3, February 1, 1980.
- Bachalo, W.D. and Houser, M.J., “Spray Drop Size and Velocity Measurements Using the Phase/Doppler Particle Analyzer”, Proceedings of the ICLASS (Third International), July, 1985.
- Bade, K.M and Schick R.J. ., “Volume Distribution Comparison Methods for 1D, 2D, and Point Measurement Techniques”, Proceedings of ILASS 2008, May, 2008.
- Lefebvre, A. H., Atomization and Sprays, Hemisphere, New York, 1989.
- Ferrazza G.P., Bartell J.W. and Schick R.J., Spray Nozzle Drop Size: How to evaluate measurement techniques and interpret data and reporting procedures, Spraying Systems Co. Bulletin 336.
- Schick R.J., Spray Technology Reference Guide: Understanding Drop Size, Spraying Systems Co. Bulletin 459B.
- Brown, K., Kalata, W., Schick, R.J.,” Drop Size Distribution Analysis with respect to Height - Numerical Simulation versus Empirical Evaluation”, Proceedings of ILASS 2008, May, 2008.
- Asano, K., Mass Tansfer, Wiley-VCH, Weinheim,Germany, 2006.
- Incropera F.P. and DeWitt D.P., Introduction to Heat Transfer, 3rd Edition, Wiley, New York, 1996.