
The ability to generate simulated rain conditions is critical for testing and validation of industrial equipment, automated systems, sensors, drones, and for other purposes.
ILASS-Americas 34th Annual Conference on Liquid Atomization and Spray Systems, May 18-21, 2025
James J. Tribble, Kyle M. Bade, and Rudi J. Schick
Spraying Systems Co.
Wheaton, IL, 60189
Abstract
The ability to generate simulated rain conditions is critical for testing and validation of industrial equipment, automated systems, sensors, drones, and for other purposes. The Department of Defense Test Method Standard MIL-STD-810H Section 506.6, provides a detailed specification for rainfall rates and droplet sizes required to simulate various levels of real-world precipitation. According to the specification, the target rain rates span 1.7–14.0 mm/min with an acceptable droplet size range of 500–4500 um. Testing and analysis methods are presented to generate rain within the above specifications while maximizing the coverage uniformity of the rain over the target area. Specific rain conditions were achieved by systematically evaluating drop size distributions produced by various spray nozzles spanning low to high capacities. A careful balance is achieved between the total volume flow rate per nozzle with the spray plume coverage area and nozzle-to-nozzle overlap, leading to the final effective rain rate. Pulse Width Modulation (PWM) nozzle technology is incorporated to provide a unique scale-down capability for the total flow rate (rain rate) without affecting the drop size distribution. The resulting nozzle system produces rain with a range of low, moderate, and high rain rates with the majority of droplets within the target size range.
Introduction
Controlled rain simulation is essential for developing modern, optimized systems across various industries. Automotive technologies such as windshield wipers, tires, and LiDAR systems require testing and validation under rain for safety and effectiveness [1, 2]. Similarly, both commercial and military aircraft must function reliably in rainy conditions in-flight and on the ground [3]. In defense, precision-guided missile systems, infrastructure, and critical field equipment demand realistic weather testing [4] which can also be extended to less critical commercial systems deployed in real-world conditions. Controlled rain is also crucial in agriculture, where irrigation strategies and soil absorption can be studied under repeatable conditions [5] or applied in the field.
The U.S. Department of Defense MIL-STD-810H Method 506.6 [6] defines rain as drop diameters between 500–4,500 μm and a rainfall rate range of 1.7-14.0 mm/min depending on the severity of the weather conditions. This standard draws upon historical investigations, such as the study by Marshall and Palmer [7] in 1948 which characterized rain as having intensities between 1.0-23.0 mm/hr, with drop size distributions in the same approximate range. These references serve as benchmarks for rainfall rate and drop size distribution targets in the present investigations.
To achieve the target drop size distributions, multiple nozzles were evaluated using Particle Imaging (PI) techniques [8]. Rain rate was controlled using a Spraying Systems Co. PulsaJet® nozzle body which modulates flow via high-speed opening and closing of the orifice without significantly altering the nozzle’s coverage or drop size distribution [9]. The spatial volume distribution generated by each nozzle was imaged using Laser Sheet Imaging (LSI) techniques, providing cross-sectional spray distribution contours of the area covered by each nozzle at a 2 m spray height. The digitized snapshots were then uploaded into the Virtual Overlap Analysis (VOA) software, where the spacing between nozzles in large arrays was optimized for minimal combined spray coverage variation. The composite optimized spray nozzles and operating conditions are evaluated and summarized.
Methods
Nozzles
The Spraying Systems Co. PulsaJet® nozzle body is an electrically actuated hydraulic spray nozzle that is manufactured in many models and capacities. The PulsaJet nozzle body allows different nozzle tips to be attached; the tips used in this study are discussed in the subsequent paragraphs. One of the largest available PulsaJets, the 10000AUH-100 QC, was used in these investigations to allow large-droplets to be produced at low pressure. This PulsaJet has a 10 gpm maximum capacity and is capable of pulsing at intervals up to 600 cycles per minute. PWM control allows precise flow reduction by regulating the on/off time percentage of an embedded solenoid valve and pin (the pin plugs the orifice upon closing). For example, with PWM control, if a nozzle tip is used that produces a flow rate of 1.0 L/min at 5 psi and 100% duty cycle; that same nozzle would produce a flow rate of 0.6 L/min if operated with a 60% duty cycle [9] at the same pressure. The PulsaJet used in these experiments was tested for flow rate at four different pressures and four different duty cycles to verify the linearity of these parameters. As shown in Figure 1, the measured volume flow rates fall on the expected linear trend from 5-100% duty cycle settings.
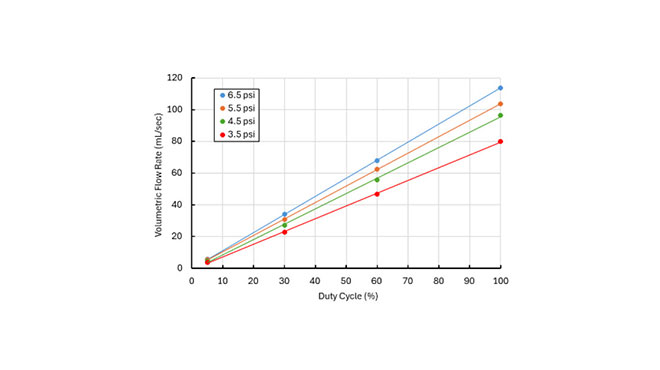
Figure 1: The trendlines demonstrating the linear relationship between volumetric flow rate of a nozzle and applied duty cycle from 5-100% for the QUA9550 nozzle tip using the 1000AUH-100 QC PulsaJet.
The pulsing action of the PulsaJet induces vibrations in the connected hardware, which can result in erratic pressure gauge readings and unreliable data from both Coriolis and ultrasonic flowmeters. This effect is made worse by the start-stop nature of the flow when using the PulsaJet with a duty cycle <100%, potentially leading to pressure build-up. To stabilize the pressure measurements 1) the gage was mounted on an pipe just upstream of the PulsaJet according to the ASME PTC 19.2 standard, 2) a glycerin-filled gauge was used to slow needle motion, and 3) a pinhole snubber was installed in front of the pressure gage; these components are outlined in Figure 2. In lieu of a flow meter, flow rates were determined via a timed volume-collection method by measuring water collected in a beaker over a fixed time period. The pressure gage setup provided nearly perfect linear duty cycle vs flow rate operation at a set pressure, as demonstrated in Figure 1, allowing very reliable pressure-flow measurements to be taken even with the pulsing spray. The linear relationship of Figure 1 further verifies the very-fast spray initiation and stopping action of the PulsaJet solenoid valve, making the transient (non-linear) portion of the spray cycle negligible.
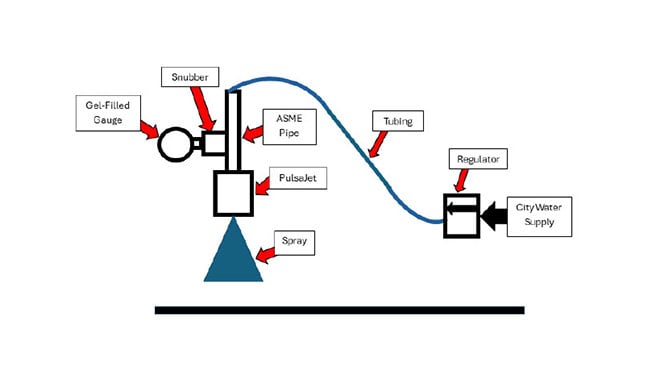
Figure 2: The flow system used with the PulsaJet nozzle setup.
A Mechanical Patternator was used to evaluate the effect of PWM control on the resulting spray spatial volume distributions generated by the flat-fan- type spray nozzles. The patternator consisted of a long, rectangular container divided into adjacent 1 x 11 in collection bins which gather the sprayed liquid, as shown in Figure 3. Images of the bin-fill-levels were imported into custom software called Patternator Image Processing (PIP), distortion-correction was applied to remove any parallax effects, and the volume collected in each bin across the major axis of the spray distribution was extracted. Results across multiple duty cycles indicate that PWM control has only a very small effect on the resulting spray widths and distributions, as demonstrated in Figure 3. Thus, for the purposes of this study, all distributions will be considered to match the 100% duty cycle (DC) condition regardless of the applied duty cycle.
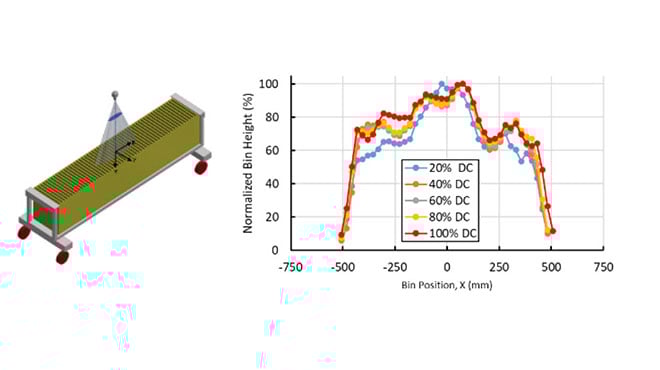
Figure 3: Mechanical Patternator schematic (left), bin position (x) vs bin height for the QUA8050 nozzle at a spray height of 1m, pressure of 4.5 psi, and varying duty cycles (right).
Several Spraying Systems Co. QHA- style full cone nozzle tips were chosen for testing. Full cone nozzles are designed to produce an axisymmetric, circular spray pattern that distributes the sprayed liquid across a target circular area. Inside the nozzle, an in-line turning vane element imparts a rotational velocity to the liquid, providing axial and rotational momentum leading to a conical spray as it exits the orifice. This internal structure contributes to a well distributed spray with relatively larger droplets, making it well-suited for the targeted large-drop rainfall. Typically, the rotational velocity required to form a full cone spray pattern does not allow fast PWM operation, but recent development has provided unique full-cone tips for this study.
Several Spraying Systems Co. QUA- style flat fan nozzle tips were also chosen for testing. Flat fan nozzles produce a spray that is wide in one direction, but narrow in the other; this pattern is fast-forming and ideal for pulsing sprays. These nozzle tips are commonly used in conveyorized coating applications where overlapping sprays are required. They are available in a wide range of capacities (orifice sizes) and spray angles, allowing for flexibility in flow rate and coverage area. The spray pattern features tapered edges, which makes these nozzles especially useful in overlapping configurations, such as in arrays designed for uniform coverage.
Liquid Distribution - Laser Sheet Imaging (LSI)
Laser Sheet Imaging (LSI) was performed with a LaVision SprayMaster system [10]. This system uses a laser with a diverging lens to generate a laser-sheet to illuminate a cross-section of the spray plume, the passing droplets scatter the 532 nm wavelength light which is imaged with a digital camera outfitted with a band-pass light filter lens to remove background structures [11]. Spray plume size, shape, and relative concentration distribution characteristics are stored digitally as a matrix of spatial intensity data for post-processing and analysis. The light intensity is scattered proportional to the surface area of the spray, with larger droplets producing a higher intensity signal. For each spray condition that was investigated, 200 images were collected and then ensemble averaged to create a visual representation of the spray at a 2 m spray distance. Regions of higher-intensity are representative of either/or large droplets or a high-concentration of droplets. LSI results are often interpreted as good approximations of the liquid-volume spatial-distribution of the spray; however, it is understood that 1) the data are actually representative of the liquid surface area of the spray and 2) the measurements are an ensemble of instantaneous distributions and therefore cannot accurately represent a true flux distribution. The LSI setup is presented in Figure 4.
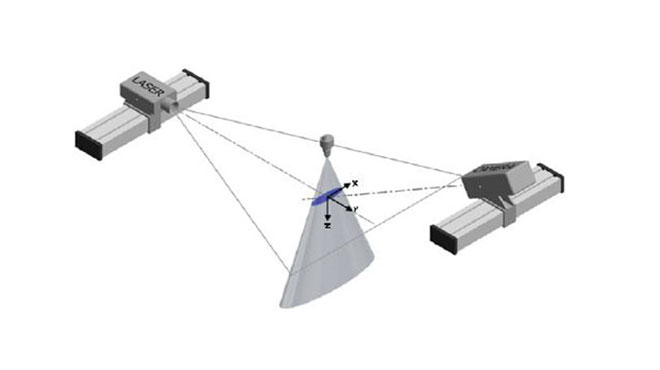
Figure 4: The LSI experimental setup used for this study.
Drop Size – Particle Imaging (PI) System
Drop size distributions were measured using an Artium Technologies Particle Imaging (PI) system, also known as a Disdrometer. The PI system uses high speed photography to capture images of droplets as they pass through the measurement region [8] located between a light source and a camera. The advanced software validates each drop based on metrics such as edge-gradient, intensity, circularity, diameter, etc. The measurement range for this system based on the validation criteria was for droplets as small as 40 μm, and as large as the field of view: 44.2 x 25.2 mm.
For the purpose of generating simulated-rain conditions, this study will focus on a few key drop size statistics such as volume mean diameter DV0.5 (VMD), DV0.1, and DV0.9. These values were extracted from the complete drop size distributions generated by imaging thousands of individual droplets for each spray. DV0.5 is a cumulative volume-based statistic which represents the size at which 50% of the total volume of the liquid sprayed is made up of drops with diameters of this size or smaller. DV0.1 and DV0.9 are values where 10% and 90% respectively of the total volume of liquid sprayed is made up of drops with diameters this size or smaller [12-13].
Drop size testing was conducted at constant pressure across multiple duty cycles to validate that PWM has no effect on drop size. No significant variation in droplet size was observed as a function of duty cycle. For each condition, 20,000 drops were imaged.
Results
Rain Rate
Rain rate refers to the cumulative liquid depth that precipitates over a given area per unit time, typically expressed in mm/min. For full cone sprays, as seen in Figure 5, the area of the pattern was calculated using the equation for the area of a circle, or A = πR2. To evaluate the effective limits of the spray plume dimensions in x and y, post-processing was performed using the ensemble average LSI results using MATLAB. The spray dimensions were calculated by summing all pixels in either the x or y directions into a single vector, as demonstrated at the bottom of Figure 5, then applying a relative threshold limit of 5%; all values below (outside) the threshold were set to zero. The bottom plot of Figure 5 includes red lines indicating where the 5% threshold was applied; it is clear that the 5% level includes nearly all the spray material, but removed the influence of very sparse droplet regions on the assessment of the effective spray plume size; this process was repeated in both the x and y directions. The volumetric flow rates for each nozzle were divided by the calculated spray plume areas to arrive a rain rate for each spray pattern in mm/min. While it is understood that the instantaneous images of the LSI tests do not provide a continuous measurement and therefore cannot be sensitive to size-velocity correlations (i.e. this is not a flux measurement), all tests were performed at 2 m from the spray nozzle, which should result in a relatively uniform droplet velocity distribution; at least for the larger, volume-containing droplets of significance.
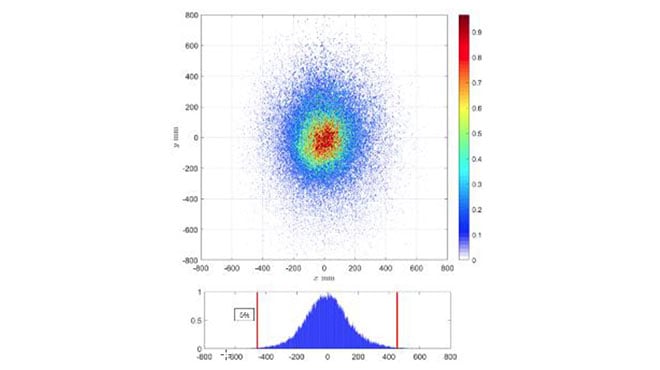
Figure 5: The 2D spray distribution (top) and 1D spray distribution with 5% threshold red-lines (bottom) of the QHA10 full cone nozzle at 4psi and 2m spray height.
The area of the flat fan sprays, as demonstrated in Figure 9, were calculated using the equation for the area of an ellipse, or A=πab where a and b are half the calculated x and y width of the spray, respectively. The widths of the ellipse shapes were calculated using the same 5% column-filtering process as with the full cone sprays, and these areas were used to convert the volume flow rates of each spray to effective rain rates.
One of the difficulties of achieving a desired rain rate is balancing the relationship between pressure, flow rate, plume shape, spray height, rain rate, and drop size [14]. As pressure is increased for a given nozzle, the flow rate will increase; however, the plume may increase in area and this increase could be more dramatic for different spray types, capacity, and angles. This balance of flow rate and rain rate can be seen in comparing the difference in Figure 6 and 7. These relationships can yield counterintuitive trends when pressure is plotted against rain rate as seen in Figure 7, particularly at lower pressures where the spray plumes may not yet be fully developed. Moreover, these same variables also influence drop size, which adds complexity to system optimization. To generate the relatively large drop sizes required by rain test specifications, the nozzles must be sprayed near the lower-end of their effective operational pressure range. A challenge then arises to balance achieving the targeted large drop size with rain rate and overall coverage uniformity, which are in conflict when adjusting the operating pressure.
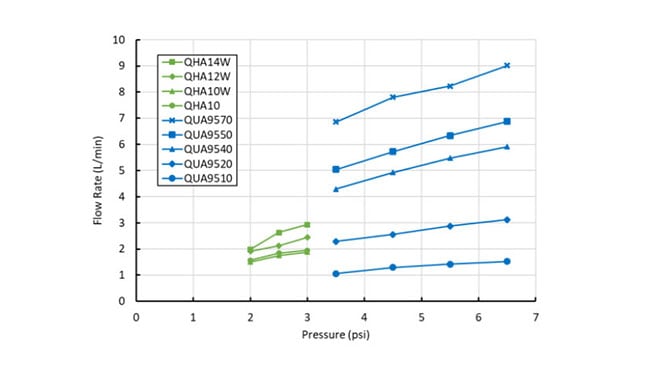
Figure 6: Pressure vs. volume flow rate for the full cone nozzles and flat fan nozzles at 100% duty cycle.
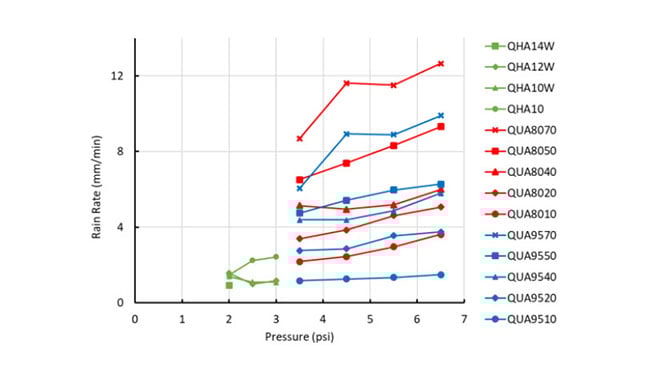
Figure 7: Calculated rain rates for individual nozzles at 100% duty cycle.
Coverage Uniformity
As the pressure is increased for a given nozzle from zero to a target pressure, the nozzle’s plume shape develops from a poorly atomized and small plume, to a fully developed wide plume. This relationship between pressure and the resulting atomization and plume size is illustrated in Figure 8, where the atomized plume can be seen to increase in size with pressure. The fast response time of the solenoid valve embedded in the PulsaJet is able to avoid reduced spray coverage between spray pulses by minimizing the transient time. It is observed that, as pressure is increased, the plume grows not only in size but also provides improved uniformity across the spray pattern. Coverage uniformity was measured using Coefficient of Variation (CoV), as defined in equation (1); where a lower CoV signifies more uniform spray intensity across the distribution relative to the mean. The CoV for the nozzle in Figure 8 dropped from 1.5 at 2 psi, to 1.3 at 4 psi, demonstrating that increasing the pressure supplied to a nozzle from below the recommended operating pressure (2 psi) to within the recommended range (4 psi) decreases the variability of the plume and provides improved coverage uniformity.
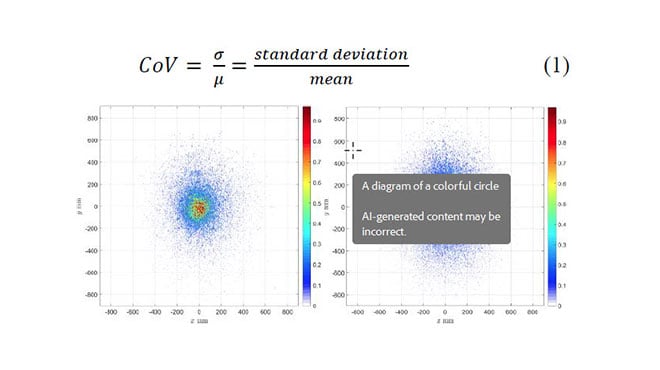
Figure 8: The QHA10 full cone nozzle sprayed at 2 psi (left) and 4 psi (right).
The spacing for the nozzle arrays was optimized for uniform coverage using the Virtual Overlap Analysis (VOA) software, which identifies the spacing between nozzles necessary to produce the lowest CoV [15]. Each nozzle and operating pressure requires a new optimized spacing due to the spray angle change with operating pressure. VOA uses an iterative algorithm to determine the optimal spacing between nozzles based on the intensity data collected from LSI. The algorithm sums overlapping spray intensities to generate a virtual layout of the resulting spray distribution while determining the optimal nozzle-to-nozzle spacing required to minimize the combined CoV. Figure 10 shows the VOA-optimized 4x5 nozzle array for the QUA9570 nozzle at 6.5 psi and the single nozzle LSI result is shown in Figure 9. Note that the VOA result in Figure 10 also includes a 15-degree nozzle rotation which is a standard practice when overlapping flat-fan sprays to promote uniformity while minimizing potential droplet collisions between adjacent nozzles. Figure 11 demonstrates a 4x5 nozzle array with the QHA14W full cone nozzle at 2 psi which is shown to cover a much larger area than the QUA9570 flat spray.
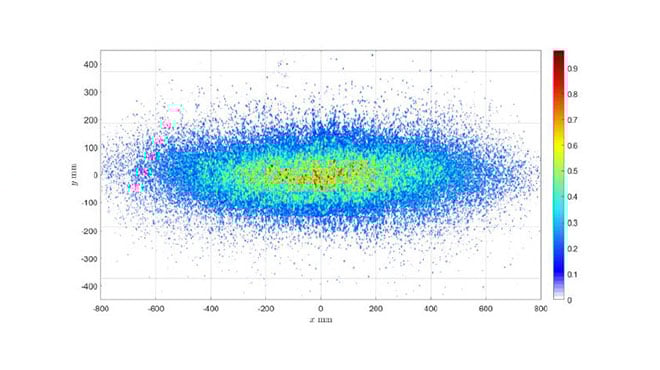
Figure 9: The QUA9570 nozzle sprayed at 6.5 psi and at 2m spray height.
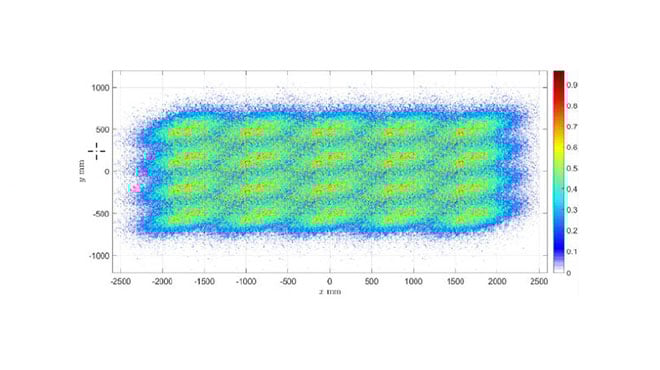
Figure 10: VOA optimized 4x5 nozzle array of the QUA9570 nozzle at 6.5 psi.
It was observed that for nearly all nozzles tested in this study, the VOA analysis yielded a smaller CoV with the overlapping nozzle arrays than with the individual sprays, this is due to the relatively low-volume edges of adjacent sprays being allowed to overlap to more closely match the higher volume spray centers. For example, the individual CoV of the spray shown in Figure 9 was CoV = 0.9, while the optimized overlapping array of 20 nozzles of the same spray in Figure 10 achieved a CoV = 0.39. The final multi-nozzle total coverage areas were determined by isolating the effective spray area using the same 5% threshold method as described around Figure 5 for the individual spray patterns.
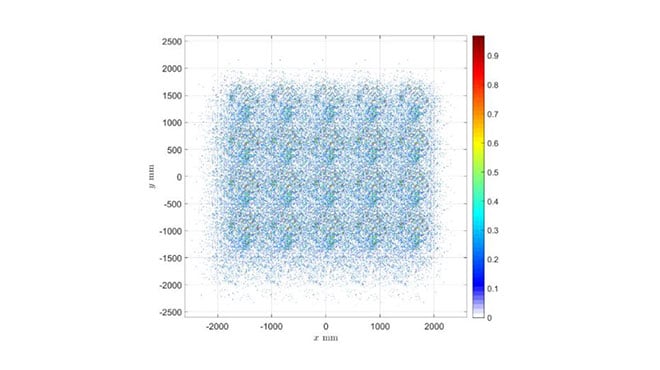
Figure 11: VOA optimized 4x5 nozzle array of the QHA14W nozzle at 2 psi.
Arrays of 20 nozzles (4x5) were created for several of the most promising nozzle candidates after initial analysis of the drop size and spray distributions. The total areas covered by the VOA-optimized arrays at several pressures are graphed in Figure 12. The flat-fan sprays were tested with 95 and 80 degree variants and, as expected, the 95-degree tips covered a slightly larger area than 80 degree tips at all capacities due to the wider spray angle. While obvious, testing of the 95 and 80 degree tips allowed careful evaluation of the drop size and coverage produced by each spray pattern to avoid any unexpected differences.
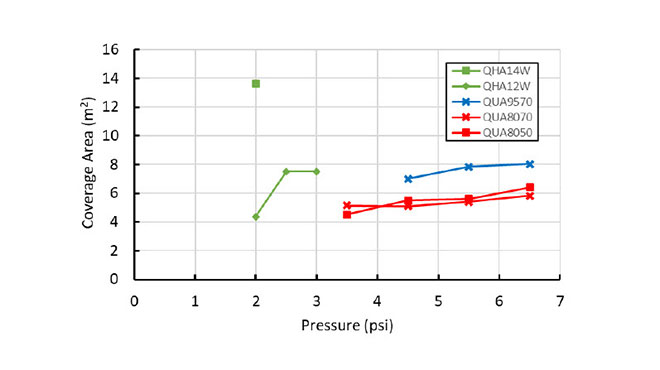
Figure 12: VOA-optimized pressure vs coverage area with several 4x5 candidate nozzle arrays.
It is clear that the QHA14W nozzle (largest full cone nozzle, with a wide-angle design) provided the largest coverage area in the VOA-optimized layout out of all the nozzles tested as seen in Figure 11. The LSI setup was unable to capture the QHA14W spray plumes at 2.5 and 3 psi due to the large plume extending beyond the camera’s field of view; the QHA12W VOA results are also provided, and demonstrate the trend with round sprays at higher pressures. The relatively unchanging coverage areas presented by the flat fan spray are expected over this relatively small operating pressure range, with a small linear increase in area as the angles increase only slightly with pressure allowing the nozzles to spread out only slightly more.
Drop Size
The DV0.5 drop size values for many of the nozzles investigated in this study are presented in Figure 13. It is important to remember that DV0.5 only provides a volume-based median representation of the overall drop size distribution, but does facilitate a concise analysis of the drop size trends. Select representative drop size distributions are provided in Figure 15 and Figure 16 for more detailed analysis. As shown in Figure 13, all nozzles demonstrated a decrease in the DV0.5 drop size with increasing pressure which is typical for hydraulic nozzles [13]; by adding pressure, the energy of the system is increased.
The full cone sprays, which were operated at lower pressures (2-3 psi), are naturally grouped on the left side of Figure 13 and shown in green. The QHA14W maintains the largest drop size over the three pressures tested which is expected with this largest capacity nozzle. Notably, the QHA10W produced the largest drop size at 2 psi, this is due to poor spray formation and this spray is therefore not a reasonable operating condition for stable and predictable operation; at 2.5 and 3 psi the drop size quickly reduces to follow the trend of the other nozzle capacities. The QHA10 nozzle produced a larger droplet size than the QHA10W, but the wider spray pattern of the QHA10W made this a more attractive candidate for a final spray solution due to the reduced local rain rate.
Examining the flat spray trends, it can be seen that the 80-degree nozzles produced slightly larger drops than the 95-degree nozzles at all pressures, which is expected for nozzles of matching capacity [14] where an increased spray angle promotes better atomization and smaller droplets [13]. The trends also show that the larger capacity nozzles produced large DV0.5 results which is preferred for the relatively large droplet size target for rain (500-4500 um).
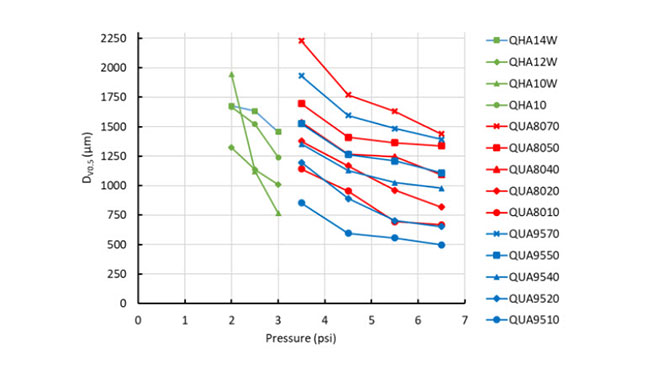
Figure 13: Pressure vs DV0.5 for various candidate nozzles.
Figure 14 presents the rain rate vs. DV0.5 graph for single nozzles sprayed at mid-range pressures and 100% duty cycle. It is observed that the full cone sprays (green markers) maintain relatively large DV0.5 values at very low rain rates (due to the wide spray patterns); because this is at 100% duty cycle, only very low rain rates may be simulated by including PWM control for lower duty cycles. For larger rain rates for full cone sprays, narrower spray angle nozzles would be required. The QUA8070 and QUA9570 flat fan sprays also produce relatively large drops, though at much higher rain rates, potentially allowing the full target range to be achieved. The smaller spray angle of the 80-degree flat fan nozzles contributes to the larger drop sizes and rain rates observed relative to the 95-degree counterparts. The higher rain rates at 100% duty cycle will allow for a larger range of rain rates from these nozzles to be produced using the PWM of the PulsaJet. For all sprays, there is also potential to allow additional spray overlap leading to increased combined rain rates, for this study, the overlap percentage was kept to a maximum of 50% to avoid triple (or more) overlapping profiles.
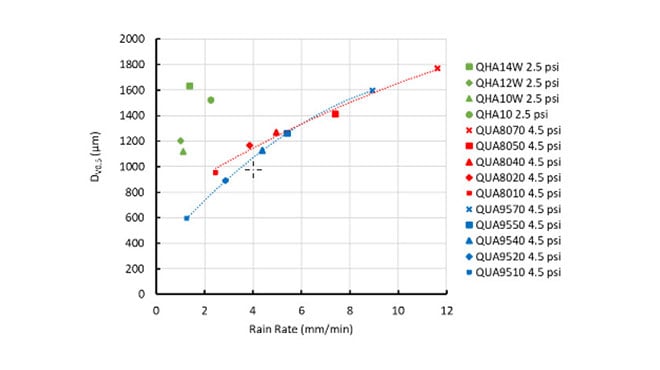
Figure 14: Rain rate vs. DV0.5 for individual full-cone (green) and flat-fan nozzle tips (red, blue) at 100% duty cycle.
Figure 15 and Figure 16 provide the cumulative volume drop size distribution results for the QHA14W and QHA10W full cone nozzles and QUA9570 flat fan nozzle, respectively. These results are representative of the full cone and flat fan spray nozzle drop size distributions and demonstrate the range of each spray distribution as well as the smallest and largest droplets generated by these nozzle types. In Figure 15, two capacities of the full cone nozzle are shown and a significant reduction in drop size with increasing pressure is found for the QHA10W, while the QHA14W changes drop size much less over the investigated pressure range.
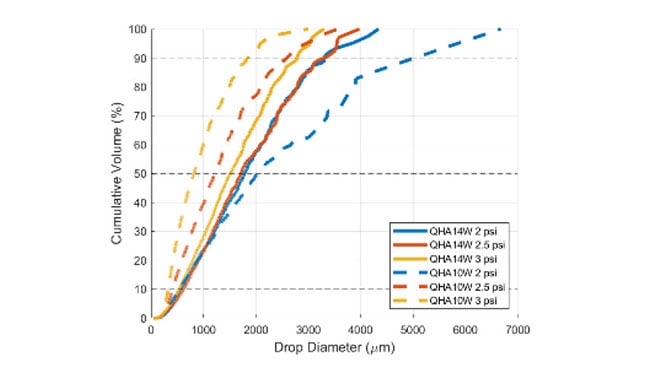
Figure 15: Cumulative volume distribution results for the QHA14W and QHA10W full cone nozzles over a range of pressures.
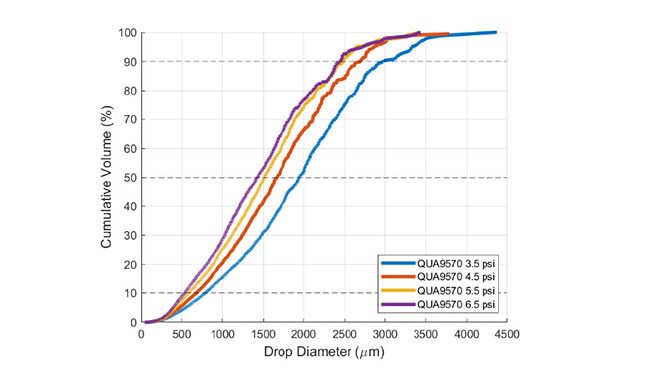
Figure 16: Cumulative volume distribution results for the QUA9570 flat fan nozzle over a range of pressures.
It is noteworthy that more than 90% of the volume for the QHA14W and QUA9570 nozzles are contained within droplets that are larger than the 500 μm; i.e. the lower limit for target drop size range. These nozzles are ultimately selected as the best candidate nozzles for the target spray system.
Summary (Best Solution)
Final candidate nozzles were selected primarily for larger drop size distributions and ideal rain rates. Several of the full cone nozzles and flat fan nozzles produced drop size distributions in which the key statistics, DV0.1, DV0.5, and DV0.9, all satisfy the target range of 500–4500 um. Based on the rain rates observed following the overlap analysis, one full cone nozzle and one flat fan nozzle were chosen for final recommendation as shown in Figure 17 and Figure 18.
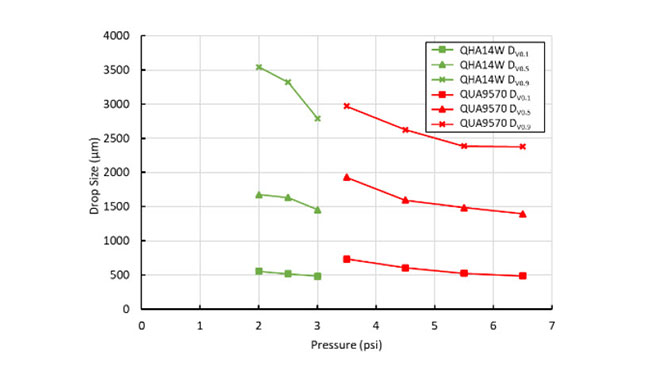
Figure 17: Pressure vs drop size for the final candidate nozzles.
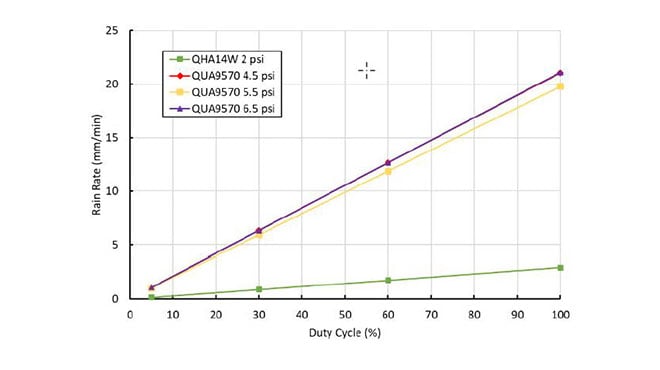
Figure 18: Duty cycle vs rain rate for the final nozzle candidates.
The QHA14W wide-angled full cone nozzle maintains a very low rain rate - just under 3 mm/min - without any use of PWM as seen in Figure 18. The large coverage area of the QHA14W makes it cost effective for use as part of a large rain simulation assembly, with the 20-nozzle array covering 13.6 m2 and likely more if the plume were able to fit within the LSI measurement region at higher pressures. When using PWM to lower the duty cycle, this nozzle can achieve rain rates as low as 0.14 mm/min. This nozzle generates a drop size distribution with DV0.1 values between 481 and 555 μm, DV0.5 values between 1456 and 1676 μm, and DV0.9 values between 2793 and 3543 μm depending on the pressure setting as seen in Figure 17.
The QUA9570 flat fan spray was observed to deliver rain rates from 0.98 mm/min up to just over 21.0 mm/min with varying pressures and duty cycles as seen in Figure 18. The 20-nozzle array of QUA9570 nozzles covers approximately 8 m2 and produces drop size distributions with DV0.1 values between 522 and 733 μm, DV0.5 values between 1392 and 1931 μm, and DV0.9 values between 2376 and 2970 μm depending on the pressure settings as seen in Figure 17.
In conclusion, two nozzles have been identified which effectively simulate rain as defined in MIL-STD-810H Section 506.6 – the SSCO, namely, the QHA14W full cone nozzle and QUA9570 flat fan nozzle. Using these two nozzles, rain rates between 0.45 and 21.0 mm/min can be achieved with the use of PWM control and the Spraying System Co. PulsaJet. Most importantly, the drop size distributions of both nozzles meet the targeted 500 – 4,500 μm range for rain drop sizes.
References
- Bartos, M., Park, H., Zhou, T., Kerkez, B., and Vasudevan, R., "Windshield wipers on connected vehicles produce high-accuracy rainfall maps," Scientific Reports, vol. 9, no. 1, p. 1647, Jan. 2019.
- Filgueira, A., González-Jorge, H., Lagüela, S., Díaz-Vilariño, L., and Arias, P., "Quantifying the influence of rain in LiDAR performance," Measurement, vol. 95, pp. 143–148, Jan. 2017
- Cao, Y., Wu, Z., and Xu, Z., "Effects of rainfall on aircraft aerodynamics," Progress in Aerospace Sciences, vol. 71, pp. 85–127, Nov. 2014.
- Westmark, C., and Lawless, G. W., "A discussion of rain erosion testing at the United States Air Force rain erosion test facility," Wear, vol. 186–187, pp. 384–387, 1995.
- Matula, J., "Possible phosphorus losses from the top layer of agricultural soils by rainfall simulations in relation to multi-nutrient soil tests," Plant Soil Environ., vol. 55, no. 12, pp. 511–518, Dec. 2009.
- MIL-STD-810H.Method 506.6, "Test Method Standard for Environmental Engineering Considerations and Laboratory Tests", United States Department of Defense.
- Marshall, J. S., and Palmer, W. McK., "The distribution of raindrops with size," Journal of the Atmospheric Sciences, vol. 5, no. 4, pp. 165–166, Aug. 1948.
- Bachalo, W.D., Manin, J., Payne, G., Fidrich, M., and Ibrahim, K., “High Resolution Cloud Particle Imaging Incorporating State-of-the-Art Digital Cameras With Pulsed LED Illumination,” SAE International, 2023-01-1421, June, 2023.
- Spraying Systems Co., "The secret to uniform coating: precision spray control," B712C, Spraying Systems Co., 2025. [Online]. Available: https://www.spray.com/-/media/dam/industrial/usa/sales-material/product-market-bulletin/b712c_industrial_pulsajet_nozzles.pdf
- LaVision GmbH, "Laser Imaging in Sprays," LaVision GmbH, 2025. [Online]. Available: https://www.lavision.de/en/products/spraymaster/laser-imaging-in-sprays/index.php
- Bade, K.M, Tribble, J.J., Schick, R.J., Spray Analysis and Research Services, Spray Distribution Differences Between a Mechanical Patternator and Laser Sheet Imaging, Spraying Systems Co., 2024
- Lefebvre, A. H., Atomization and Sprays, Hemisphere, New York, 1989.
- Schick, R.J., Spray Analysis and Research Services, Spray Technology Reference Guide: Understanding Drop Size, Spraying Systems Co., 2006
- Knasiak, K., Schick, R.J., & Kalata, W. (2007). Multiscale design of rain simulator. Proceedings of the 20th Annual Conference on Liquid Atomization and Spray Systems (ILASS-Americas), Chicago, IL
- Spraying Systems Co., "SprayScan VOA” B777, Spraying Systems Co., 2021. [Online]. Available: https://www.spray.com/-/media/dam/industrial/usa/sales-material/product-market-bulletin/b777_sprayscan-voa.pdf