

Knowledge of spray characteristics is vital for many processes within industry and academic work. Phase-Doppler instruments are widely used to collect drop size, velocity, and flux data within sprays, but often require measurements at a large number of points. Acquisition of these data can be time-consuming and costly. This work shows the development of a testing methodology to allow efficient measurement of spray plumes, with the ability to accommodate any plume shape.
Download the PDFOn the development of efficient point-measurement sampling of spray plumes using volumetric distributions
ICLASS 2018, 14th Triennial International Conference on Liquid Atomization and Spray Systems
Chicago, IL, USA, July 22-26, 2018
A. E. Perri, K. M. Bade, R. J. Schick
Spray Analysis and Research Services
Spraying Systems Co.
Wheaton, IL 60187 USA
Abstract
Knowledge of spray characteristics is vital for many processes within industry and academic work. Phase-Doppler instruments are widely used to collect drop size, velocity, and flux data within sprays, but often require measurements at a large number of points. Acquisition of these data can be time-consuming and costly. This work shows the development of a testing methodology to allow efficient measurement of spray plumes, with the ability to accommodate any plume shape. The method consists of a two-phase approach. First, the spray is sampled to capture the distribution of the spray in the target plane, for example, using laser sheet imaging. This broad characterization is then analyzed with an iterative fitting algorithm which determines the necessary point-sample locations for a precision instrument focusing on the planar distribution gradients. In the second phase, the spray plume is sampled with a precision instrument at the predetermined locations. For validation, the fitting algorithm may be performed in parallel with the discrete sampling, with each iteration using a new point-sample. Point-sampling may continue until the desired accuracy is achieved. Validating experiments are performed using laser sheet imaging for phase-one and a Phase Doppler Interferometer in phase-two. It is found and demonstrated that the proposed two-phase experimental method allows for accurate predictions of spatial spray characteristics and provides a means for comparative analysis while preventing diminishing returns through over-sampling within a spray pattern. In the provided study, the methodology was able to obtain an accuracy of 5% while utilizing only 7% of the points.
Introduction
Characterization of spray nozzles is a necessary process for many industrial and academic applications. Using advanced droplet characterization equipment, drop size distributions may be characterized and represented by statistics such as the Arithmetic Mean, Sauter Mean Diameter, and many other values often tailored to the needs of the application. These statistics may be representative of distributions collected at a point within a spray, or represent the entire spray plume. An excellent resource for these statistics can be found in work by Lefebvre [1]. To obtain these data, a wide variety of spray measurement instruments have been developed; each with unique strengths and weaknesses. These instruments and their optimal use are thoroughly reviewed by Falser and Parrish [2].
In practice, design applications frequently call for high spatial resolution of drop size distributions within spray plumes. Examples of these applications would be use in high fidelity seeding for particle tracking CFD analysis; determining the optimal positioning of distributions for applications, or fine-tuning and validation in prototype development. To obtain these information dense models, experimentalists often utilize point measurement techniques such as an Artium Technologies, Inc. Phase Doppler Interferometry instrument (PDI). The PDI provides a method to obtain temporal data concerning drop size, multi-directional velocity, and flux.
In an ideal situation, experimenters can thoroughly sample a spray, building a high-resolution image of the plumes structure, perhaps even in replicate. Unfortunately, point-sampling in this volume is often not feasible, as experiments are usually subject to limitations such as time, material, or cost. To save resources, assumptions are made such as symmetry and smooth transitions of the data distributions between each sampling location. In Bade and Schick [3] [4] develop methods to generate planar spray statistics [4] and distributions [3] from point measurements, and also identify general rules for the number and location of point sampling in a few example sprays. This study is instructive in its data reduction and weighting techniques, but limited in the identification of optimal test points to specific spray types. Additionally, performing these resource-saving steps are not without their drawbacks. By assuming symmetry, it opens the model to inaccuracies concerning actual asymmetries due to streaks, heavy edges, or non-apparent regions of heavy flow may arise. Assuming smooth transitions between samples is reasonable for many polydisperse sprays; however, the experimentalist is left wondering what is the necessary amount of points required to adequately resolve the distribution of various spray characteristics. Improper step sizing and placement applied have the chance of partially truncating critical locations of the spray, such as areas of maximal flux between step sizes. Additionally, imperfections such as streaks again pose difficulties as the spray characteristics of the streak may either skew the results or be missed entirely if it falls between samples.
Bade and Schick [3] [4] develop methods to generate planar spray statistics [4] and distributions [3] from point measurements, and also identify general rules for the number and location of point sampling in a few example sprays. This study is instructive in its data reduction and weighting techniques, but limited in the identification of optimal test points to specific spray types.
In this work, an alternative technique is developed to efficiently point-sample sprays, generating a plume model which maintains the relations of statistical information with its physical positioning. This two-phase technique is designed to leverage the strengths of broad plume characterization techniques with those of information dense point-sampling methods. In the first phase, a broad technique is used to get an overall observation of the plum, but also providing the basis for a fitting algorithm. Through the use of a fitting algorithm, not only are the sample locations determined, but foresight is provided on the necessary number of sample locations required to obtain a level of accuracy; thus, avoiding diminishing returns and preserving resources for replicate measurements. In the second phase, a point measurement device is used to acquire the statistical data relative to that sample location. By performing the same fitting method between samplings, the final model is iteratively generated.
Experimental Methods
In this study, a Spraying Systems Co. UniJet® TPU650060-TC hydraulic spray nozzle was selected due to its extensive analysis as well as complete coverage in previous studies by Bade and Schick [3] [4]. This nozzle produces a tapered flat fan spray pattern with a uniform distribution of small to medium sized drops. The nozzle was operated at a liquid pressure of 4.0 bar, with a resulting flow rate of 225 mL/min. The spray may be regarded as symmetric about the x axis or y axis, but it is not axi-symmetric. The nozzle was sprayed downward, and samples were acquired at a distance of z = 50 mm.
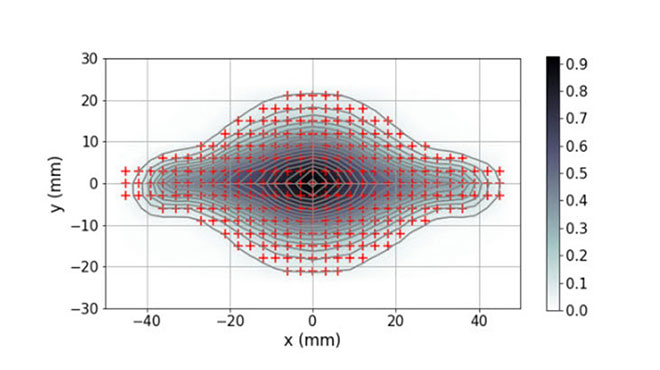
Acquisition of a 2D broad characterization contour was collected using Laser Sheet Imaging (LSI) with a LaVision SprayMaster system. The high spatial resolution contour is composed of the average of 200 instantaneous images of the sampling plane. The values presented are of the relative light intensity, I, which is scattered according to Mie theory and is directly representative of the ensemble average droplet surface area. The xy spatial resolution of the LSI system for this acquisition is 0.24 mm/pixel. The LSI patternation of the TPU650050-TC may be observed in Figure 1. Contour lines are provided at 5% intervals of the maximum observed intensity. Though the intensity is not directly related to volume; in previous work by Bade, et al. [5], the TPU650050-TC tip was tested with both Mie and Light-Induced Fluorescence (LIF) methods, and it was found to be comparable to the planar volume distribution.
The point-measurement device used was an Artium Technologies Phase Doppler Interferometry PDI-200MD. The instrument was used to acquire drop size, velocity, and local volumetric flux measurements across the sampling plane. For Figure 9, samples originated at the nozzle center point and spanned the entire pattern in 3 mm increments in both x and y directions, for a total of 273 measurements (annotated with red crosses in Figure 1). The density of sampling locations was chosen such that there is at least one measurement for every 5% interval observed within the LSI contour. The solid-state laser systems used in the PDI-200 MD are Class 3B lasers and provide approximately 200mW of power per beam. The laser power is intense enough to help offset spray density effects. The transmitter and receiver were mounted on a rail assembly with rotary plates at a 40◦ forward scatter collection angle. The lens setup consisted of a 500 mm / 500 mm focal length arrange for the transmitter and receiver units, respectively. This configuration resulted in a droplet size range of approximately 3-480 µm, ensuring capture of the full range of droplet sizes while maintaining measurement resolution. Additionally, in previous work by Bade and Schick [6], the PDI was shown to be accurate within 2% for volumetric flux measurements; when properly considering droplet trajectory.
Methodology
The proposed sampling technique is a methodology which leverages broad characterization as well as the correlation between desirable statistics to identify the vital few test locations for model development. The result is a blended use of a broad technique for to maintain an overall view, a point-measurement technique to provide needed information density, with aspects of curve fitting and Pareto’s law to remain efficient and accurate. In practice, this technique is performed in two phases. In the first phase, the spray pattern is sampled using the broad technique which maintains spatial ensemble as well as gradients. Example techniques would be the use of mechanical patternators, or in this works case, Lase Sheet Imaging. Whichever technique is used to capture the spatial gradients, it should yield data which are correlated to the desirable statistics obtainable by point-measurement instruments such as the Phase Doppler Interferometer. In the second phase, the algorithmically chosen sampling locations are then acquired sequentially by the point measurement technique, using the same fitting procedure to from phase-one. By making use of the correlation, sampling in this manner not only builds a model of the broad characteristic, but also all parameters with a strong correlation to the broadly acquired characteristic.
For the discussion of the first phase, this paper will demonstrate the sampling methodology using a 1D distribution of all the PDI samples along the major axis of the TPU650050-TC (though any distribution obtainable by the broad technique is suitable). The fitting algorithm will then be applied to the 1D distribution, to determine the vital few test locations, as well as cover other insights gained at this level of analysis. After the 1D analysis, the same techniques will be applied to the 2D LSI distribution, which highlights the techniques scalability, and capability of generating higher dimensioned models for correlated statistics, regardless of shape.
Phase 1: Broad Sampling and Point Determination
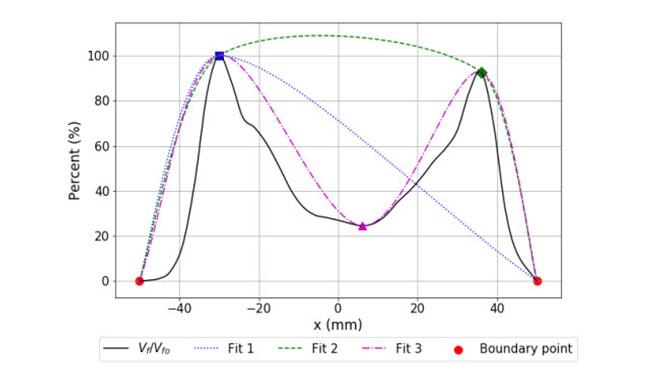
The sampling process for the fitting algorithm begins with a high-resolution spatial distribution of a correlated variable to the desired characteristic. For brevity, this paper will focus on Sauter Mean Diameter, D32, and average axial velocity, Vz. To demonstrate the technique, post-hoc sampling will be performed using PDI values across the x-axis of Figure 1. For the correlated variable distribution, the volume flux was chosen as this may be mimicked inexpensively using a mechanical patternator with small enough bin sizes to represent the 3 mm spacing. The local volume flux distribution for this example can be observed in Figure 2. Note that the x-axis spans beyond the scope observed in Figure 1; this is due to the addition of boundary points (annotated as red circles). The purpose of the boundary points is to provide a basis for the first linear fitting (Vf /Vfo = 0 in this case) as well as seed the model with "free" information. As the boundary values are located outside of the distribution, the values may safely be assumed to be zero for all characteristics. Ideally, the boundary points should enclose the distribution as close as possible, so the algorithm focuses on the data distribution rather than the space surrounding it.
At this stage of development, an optimal fitting spline algorithm is not determined. In practice, an ideal fitting spline should remain bound to the limits of the data distribution, avoiding spline types which may yield oscillations. With this recommendation, linear splines are perfectly acceptable; however, the authors chose to present the algorithm using 3rd order Bezier splines. The choice of Bezier splines enables for smooth transitions between knots allowing the curves to mimic the continuous polydisperse nature of most operational sprays.
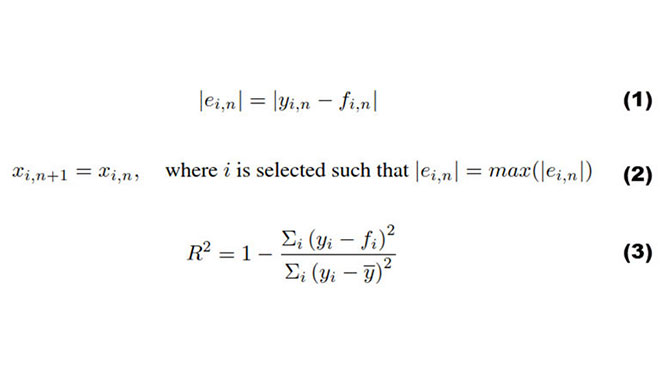
Each iteration, n, of the algorithm begins by finding the absolute value of the error residuals for each available location, i, between the data distribution, f and the current fitting spline, y, Equation (1).
To progressively reduce the error, the optimal sampling location for the next iteration is the location which provides the maximum error residual for the current iteration as in Equation (2).
After performing the first fitting, the coefficient of determination may be calculated, Equation (3).
Coefficient of determination values, as well as the corresponding sampling location, are stored at each step to select the optimal number of points for the second phase.
Figure 2 shows the first three iterations of the residual reducing spline fitting. As points are progressively added, rapid increases of the coefficient of determination are observed. Within three selections, the R2 values are approaching 0.6, by five points the value is greater than 0.9.
At this stage, the algorithm may be run for as many iterations as there are points forming the data distribution. Before transitioning to the point-measurement sampling phase, the constructed coefficient of determination curve should be inspected (Figure 3). In this curve, the number of points of which to sample may intelligently selected. In Figure 3, diminishing returns are encountered on the information gained per sample location by the fourth to sixth sampling location (R2 = 0.8 to R2 = 0.95). For phase-two, the first eight points will be selected corresponding to an R2 value of 0.98.
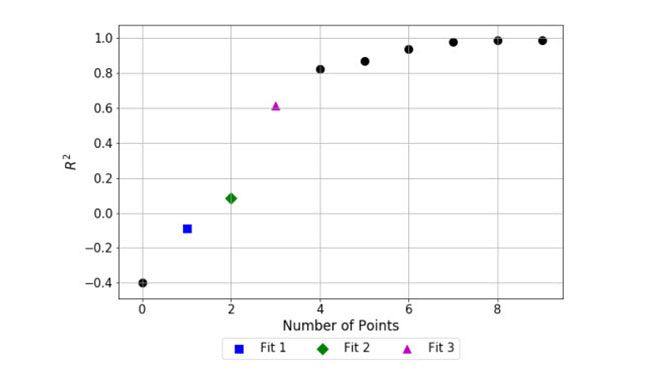
Figure 3: Coefficient of determination values, R2, with respect to number of selected locations.
Phase 2: Point-Measurement Sampling
In phase-two, samples are acquired using the point-measurement device at the prescribed locations predetermined in phase-one. As samples collected at each location,one gains information on all spray characteristics capable of being provided, beyond those obtained during phase-one. By making use of the correlation between the various spray statistics and the broadly sampled characteristic, splines may be constructed just as in phase-one, for the newly acquired spray characteristics.
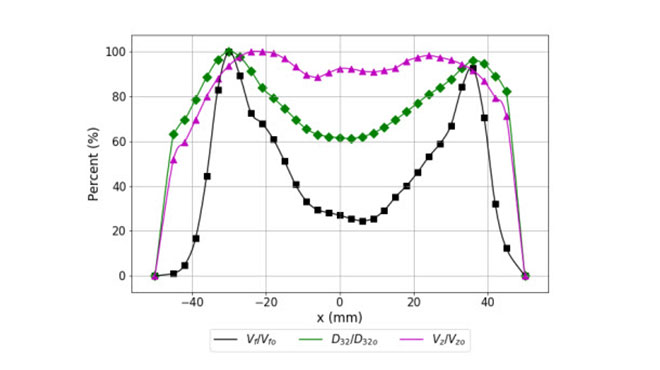
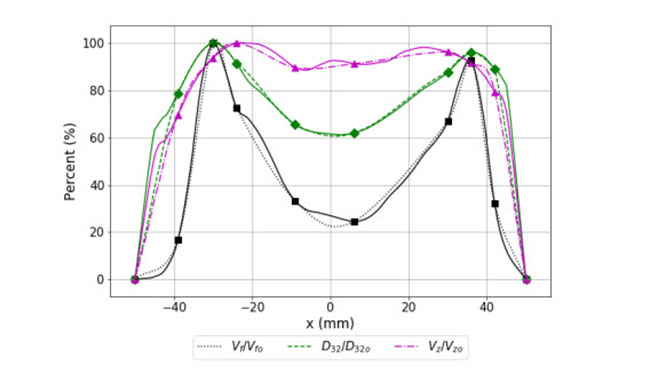
In Figure 4, one can observe the normalized distributions of local volume flux, Sauter Mean Diameter, and average axial velocity if one were too sample at 31 sampling locations (with two additional boundary points) across the x-axis of Figure 1. Figure 5 using only the eight selected points from phase-one and utilizes splines to construct the rest of the curves. The resulting splines for each spray characteristic correspond to an approximate coefficient of determination value of 0.98; however, these values were obtained using only 26% of the original sampling locations.
2D Application
The same procedure performed for the 1D case, may be expanded to a 2D case by modifying the technique used to gather the broad characterization and finding suitable spline algorithms to perform the fitting iterations. For the 2D analysis, the LSI distribution as observed in Figure 1 is used to provide the broad characterization. For the spline interpolation, the authors chose to use linear radial basis functions to approximate the contour. The radial basis functions used are openly available in the Scipy library for Python[7]. In Figure 6, one can observe the LSI patternation of the TPU650050-TC. Boundary points, noted as blue crosses, follow the border of the figure at y = ±30 mm and x = ±150 mm. In the 2D case, one is not limited to the assignment of boundary points as long as the locations may be safely assumed to be outside the spray. The 2D analysis provided in the paper assign a total of 108 boundary values, and a free as their values are held at 0 for all iterations.
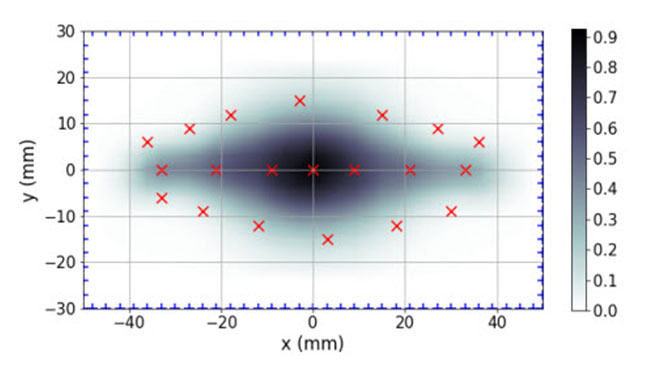
Figure 6: Laser Sheet Image Intensity distribution overlayed with 20 select sampling locations and boundary points.
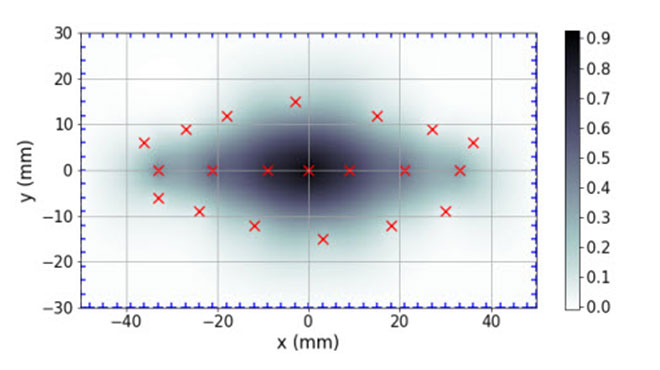
One may then perform phase-one of the sampling technique to build the coefficient of determination plot as observed in Figure 8. Observing Figure 8, diminishing returns are found after approximately 20 sample locations, which yields a R2 value of 0.98. Figure 7 provides the resulting contour fit constructed out of the 20 select locations using the radial basis functions.
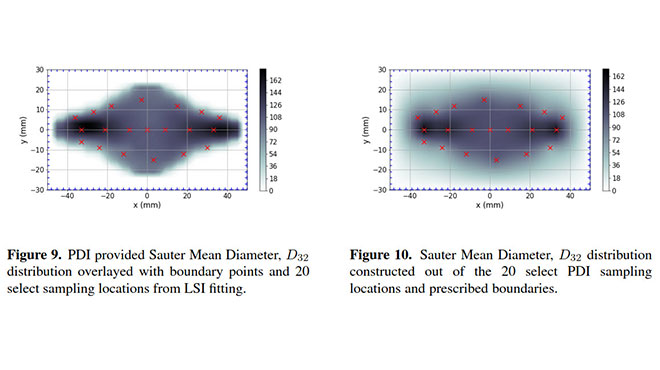
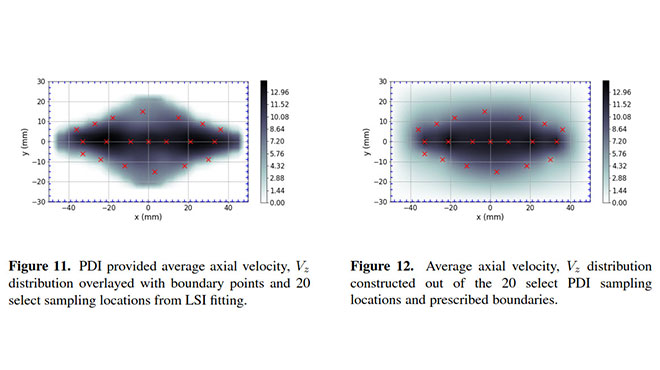
In phase-two, samples are acquired at the prescribed locations and utilizes the same radial basis functions to construct contours of the desired spray characteristics. Using only the Sauter Mean Diameter values at the prescribed locations in Figure 9, one can construct the model in Figure 10. This process can be performed similarly for average axial velocity in Figures 11 and 12.
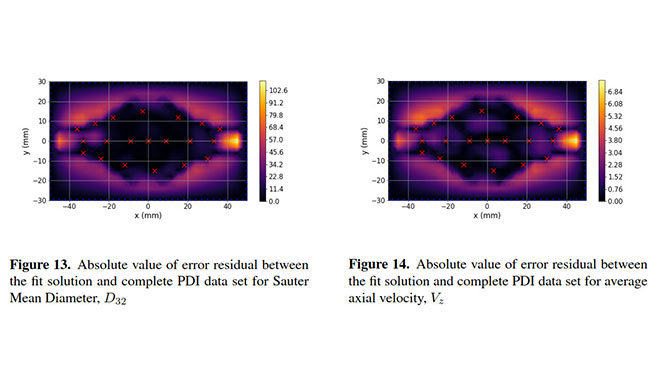
The final absolute error residual contours between PDI values and fit values for D32 and Vz may be observed in Figures 13 and 14.
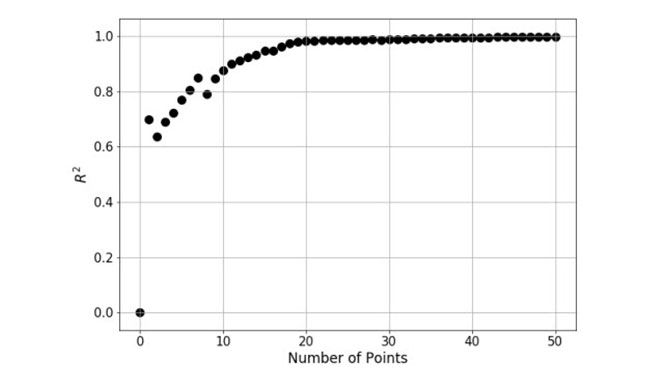
Figure 8: Coefficient of determination values, R2, with respect to number of selected locations for the 2D case.
Results and Discussion
Inspecting the algorithmically determined sampling pattern (Figure 6 and 7) reveals enclosing pattern which follows the edges of the data distribution along with internal locations spanning the width. Minor and major axis spanned sampling has previously been investigated by Bade and Schick [3], and it was found to produce the lowest error sequences for composing a holistic spray characteristic. This method suggests that accuracy may be retained by including the circumferential measurements at the expense of axial measurements for a complete model. Figures 13 and 14 demonstrate excellent accuracy of the fitting technique, provided that the spray distribution is enclosed within the preselected locations. The residual error within the enclosing points indicates errors of less than 5µm for D32 and 0.5 to 0.75 m/s for Vz.
In both figures, there is a noticeable error which occurs at the edges of the spray. The most likely explanation for this error is the lack of fluid volume at these problem areas. Upon close inspection, it is observed that on the edges of the intensity distribution (Figure 6), the values taper to approximately zero, whereas at the same location (x=42mm for instance) PDI data may still be acquired (Figures 9 and 11). In Figure 4, however, the regions are shown to have significantly reduced volume flux. In previous studies, it was shown that the volume flux distribution may be used as a key parameter in determining the overall attributes of a spray distribution (Bade and Schick [3]). In comparison to this study, this technique stresses the most vital sections of the spray (high flux locations) are considered for characterizing the spray plume. In line with this concept, the observed regions of error are primarily a visual problem rather than technical; as these regions often contribute little to a spray’s overall performance. Though this attribute shows applicability for a large range of applications; there may exist uses for modeling the sparse edges of the sprays, such as consideration over-spray. For these applications, further investigations of this particular quality are justified; increased resolution may be possible incorporating a circumferential technique to better enclose the data distribution.
Despite errors isolated to sparse regions, the technique shows promise due to the efficiency and accuracy of the model enclosed by selected locations. In this region, the error of the model is less than 5% at any location for both D32 and Vz. Additionally, to acquire this high resolution only 7% of the available test locations were necessary. The accuracy of this model by be elevated, in practice, as most sprays allow for observation of the shape, enabling further customization of the boundary region (for example, by enforcing a tighter enclosure of boundary points or by the addition of isolated boundary points inside the domain.) An additional benefit to this technique is that at no point was the shape of the spray pattern considered as input. All point selections were algorithmically determined from the broad distribution. From this, one can gather that the algorithm would adjust itself according to a sprays unique characteristics such as shape, operating conditions, or even imperfections.
Summary and Conclusions
An innovative sampling technique was introduced to efficiently create characteristic models of an asymmetric spray pattern. The proposed methodology is performed the technique in two phases. In the first phase, ensemble information is gathered for at least one variable correlated to those desired in the final model. For instance, one may use a mechanical patternator to collect volumetric distributions; or one may use Laser Sheet Imaging to gather information for a 2D model. Splines then fit to the data, iteratively improving the broad characteristic fit while noting the positions required as well as the coefficient of determination. In phase-two, the coefficient of determination values are used to determine the optimal number of sampling locations to acquire the desired accuracy, avoiding diminishing returns when point-measurement sampling. As spray characteristics are acquired using the point-measurement device, the same fitting procedures are performed on the correlated characteristics to build an accurate model of the spray.
It is found that the method delivers values within 5% accuracy for all correlated variables within the region enclosed by the algorithmically selected points. Additionally, this accuracy is obtainable using only 7% of the total points of the high-resolution point-sampling pattern. Regions between the selected points and boundaries are subject to error, at times significantly. It its noted however, that at these regions the volumetric flux is often tending to zero; reducing the significance of these errors.
Future efforts will go into refining these locations by either restricting the boundary region or by the development of a circumferential algorithm. As the algorithm may operate without any input of shape, future studies will test with more complex shapes such as multi-orifice nozzles or array patterns. The technique also is independent of the broad characterization technique, making it possible to branch into 3D models with proper fitting algorithms.
Acknowledgements
The authors would like to acknowledge and thank Krunal Patel of Spraying Systems Co. for his assistance in the laboratory supporting this work.
References
- Lefebvre, A. H., Atomization and Sprays, Combustion: An International Series Hemisphere Publishing Corporation, 1989
- Falser, T. D., Parrish, S. E., Spray Measurement Technology: A Review, Measurement Science and Technology, vol. 26, pp.1-34, 2015.
- Bade, K. M., Schick, R. J., Post-Processing of Phase Doppler Interferometry Data for Planar Spray Characteristics, ILASS-Americas 25th Annual Conference on Liquid Atomization and Spray Systems, Pittsburgh, PA, May 5-8, 2013.
- Bade, K. M., Schick, R. J., Generating Planar Statistics From Point Measurements in a Spray, Atomization and Sprays, vol. 26, issue 10, pp. 1009-1030, 2016.
- Bade, K. M., Cronce, K., Schick, R. J., Development of Low-Order Regression Models for Selected Flat Spray Characteristics, 12th Triennial International Conference on Liquid Atomization and Spray Systems, Heidelberg, Germany, pp. 1-8, September 2-6, 2012.
- Bade, K. M., Schick, R. J., Phase Doppler Interferometry Volume Flux Sensitivity to Parametric Settings and Droplet Trajectory, Atomization and Sprays, vol. 21, issue 7, pp. 537-551, 2011.
- Jones, E., Oliphant, T., Peterson, P., et al. SciPy: Open source scientific tools for Python, 2001-, http://www.scipy.org/ [Online; accessed 2017-11-28].